Radiomics: Feature selection 3 기본 콘텐츠로 건너뛰기

Radiomics: Feature selection 3

 Demircioğlu, Aydin PhD Benchmarking Feature Selection Methods in Radiomics, Investigative Radiology: January 18, 2022 - Volume - Issue - doi: 10.1097/RLI.0000000000000855


High dimensionality of the datasets and small sample sizes are critical problems in radiomics.

Therefore, removing redundant features and irrelevant features is needed.


Overall, per dataset, 

30 different feature selection methods +

10 classifiers +

70 hyperparameter settings


After each feature selection method, 1, 2, ..., 64 features were selected.

Altogether, 14,700=30✕70✕7 models were fitted, each with a 10-fold cross-validation.


More complex methods are more unstable than simpler feature selection methods.


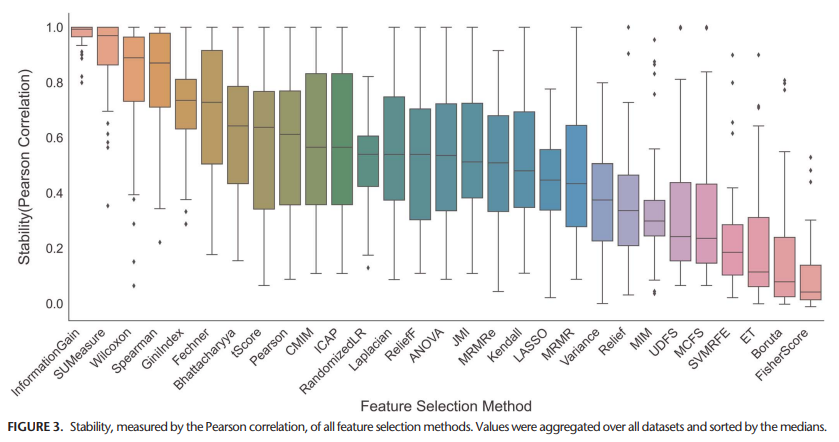
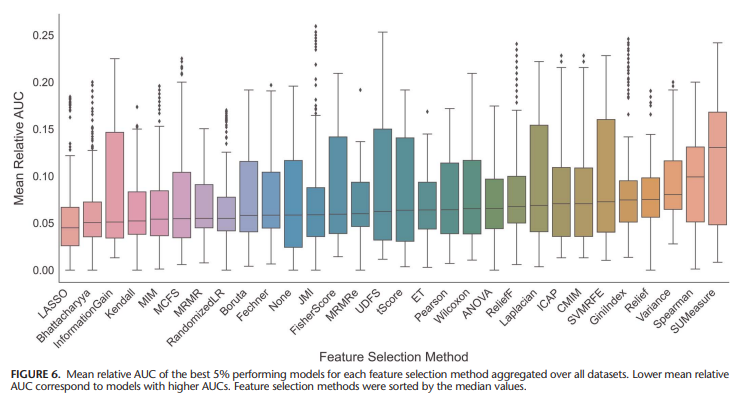
LASSO performed best when analysing the predictive performance, though it showed only average feature stability.


Longer training times and higher computational complexity of the feature selection method do not mean for high predictive performance necessarily.


Obtaining a more stable model might entail a slight loss in predictive performance.


Therefore, this paper recommends considering feature selection methods that are not too complex.

 ⇨ ①ANOVA, ②LASSO, and ③MRMRe are good candidates for feature selection.

 ⇨ if these 3 methods do not show adequate predictive performance, another methods like Boruta or MIM(mutual information) should be considered.

 ⇨ or fast methods like Pearson, multicluster feature selection, unsupervised discriminative feature selection could be considered.


No single feature selection method dominated others.


The features generated by a pretrained convolutional neural network are more robust, show smaller variance, and are less affected by acquisition parameters.


댓글

이 블로그의 인기 게시물

일치도 통계와 paired t-test

Why using a paired t test to assess agreement is problematic? by Nikolaos Pandis https://doi.org/10.1016/j.ajodo.2021.07.001 Agreement 를 평가함에 있어 paired t-test를 사용하는 논문들이 몇 있다.  임상논문에서 의료기기가 측정한 것의 일치성, 혹은 의료행위자 A와 B가 측정한 것이 비슷한지를 측정하는 일들이 꽤 많은데, 여전히 많은 논문들에서 paired t-test에서 p>0.05 라는 통계 결과를 얻었을 때 '두 기기에서 측정한 수치는 일치한다.' 혹은 '의사A와 의사B가 측정한 수치는 일치한다.' 라는 결과를 내린다. 통계를 배울 때, "짝지어진 두 모집단의 차이를 보고 싶을 때는 paired t-test를 사용한다." 라고 많이들 배우는데, 아마 이렇게 배우기(?) 때문에 '그럼 paired t-test의 p-value가 0.05보다 크면 두 집단 간 차이가 없다는 것이겠네?'라고 많은 사람들의 생각이 이어지는듯하다. 그러나 내가 통계적으로 살펴보고 싶은 것이 "Agreement"라면 paired t-test를 사용하는 것은 잘못 되었다. 그 이유에 대해서는 다음 두 개의 시나리오를 이용해 설명해보도록 하겠다. 시나리오A와 시나리오B에는 시간 차이를 두고 같은 subject를 측정한 Time1 수치와 Time2 수치가 있다. 시나리오A와 시나리오B 모두 Time1과 Time2에서 측정된 수치의 평균은 10.45로 동일하다. ✔️먼저 시나리오A 를 살펴보자. 시나리오A에서 Time1과 Time2의 평균은 10.45로 동일하므로, 차이 d의 평균도 0이고 따라서 paired t-test를 진행하면 p-value가 1로 나올 것이다.  그럼 Time1과 Time2가 동일한 수치를 냈다고 결론지을 수 있는가? 시나리오A의 각 subject를 대상으로 시간 차이...

통계검정 : (1) 두 모비율의 추정과 가설검정

 지지율, 실업률, 불량률과 같이 모집단의 비율(p)을 추정하는 문제에 대해 생각해보자. 모집단이 두 개의 배반사건(찬성, 반대)으로 구성되어 있을 때, 찬성 모비율을 p, 반대 모비율을 (1-p)라 칭한다. $$ \widehat{p}=\frac{X}{n} , E(\widehat{p})=p, Var(\widehat{p})=\frac{p(1-p)}{n} $$  이때, 모집단에서 n개의 표본을 뽑으면 찬성자수 X는  표본수 n, 성공률이 p인  이항분포 B(n, p)를 따른다. $$ X \sim B(n, p) $$ E(X)=np, Var(X)=np(1-p) 이므로, $$ E(\frac{X}{n})=p, Var(\frac{X}{n})=\frac{1}{n^{2}}Var(X)=\frac{1}{n^{2}}np(1-p)=\frac{p(1-p)}{n} $$ 자세한 증명은  http://www.stat.yale.edu/Courses/1997-98/101/binom.htm  를 참고하면 된다. 표본크기가 충분히 크다면 표본비율은 정규분포를 따른다. $$ Z = \frac{\widehat{p}-p_{0}}{\sqrt{p_{0}(1-p_{0})/n}} , Z \sim N(0, 1) $$